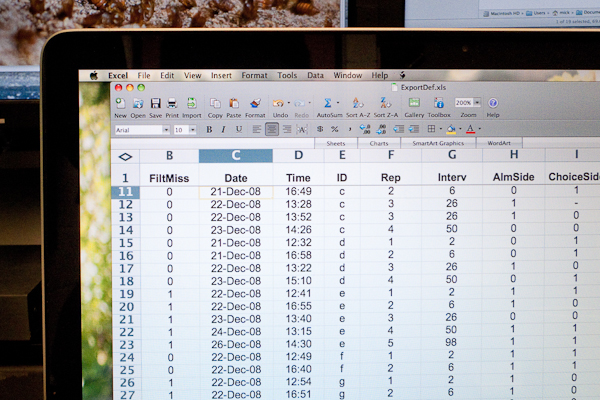
Making data usable can be tedious, sometimes tricky and usually time consuming. I use scripts to automate and speed up the process so you can spend more time on things like preparing a presentation or thesis. I can also help you summarize the data with descriptive statistics and visualize it using comprehensive graphs.
Data management:
- extracting data from files into a usable format of your choice
- recoding/extracting implicit data (e.g. flagging sequences of events), often not though of when recording the data
- verification and error detection
- scripts for you to use in Excel, R, etc.
Visualization: This service provides you with descriptive statistics and figures to explore your data and quickly see its key features:
- figures to show: distribution, clustering, outliers, trends and relationships among variables. All figures are custom-made so virtually any specification is possible
- descriptive statistics of the above (in numbers)
- interpretation of the figures and statistics

